 |
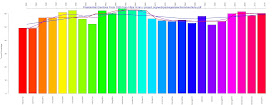
| An historical Presidential Election Turnout chart. The data is from Willem M. van der Wal Elections (R) package. Plot functions for lines: blue = lowess(), red = smooth(), purple = smooth.spline(). Click to enlarge the chart. |
mean 57.308
median 56.900
mad 4.893
sd 4.363
min 48.900
max 63.800
var 19.037
cov 19.037
fstd.err 0.873
The long scale wave below gives the appearance of a K Wave or Kondratiev wave lasting about 60 years. This fits especially if we discard elections of 1920 and 1924 and so begin the modern economic cycle in 1928. The depression years of the 1930s and WWII era gives way to a long scale rise in Presidential turnout (and middle class affluence) that peaks with the election of JFK in 1960. This subsides into a type of voter apathy of the late 1970s and 1980s which reaches a trough in 1988. (GHWB election). Clearly, Presidential Election turnout has been on a strong rise since at least 2000 (GWB election).
Perhaps one could posit a type of "Weimar Era" effect on 20th Century Presidential election participation in America. In between eras of "Authoritarian/Republican" leadership (e.g. Hoover, Nixon, Reagan, Trump), affluent educated middle classes combine with dissatisfied and empowered working classes to lead a charge to elect more "Middle Class/Democratic" (e.g. Roosevelt, Kennedy, Clinton, Obama) leadership. After some time, growing social affluence causes a disconnect between the lives of the upper middle classes and working classes, leading to political opportunity for more "Authoritarian/Republican" leadership that produces favorable conditions for the economic elite. These conditions eventually create lower wages, more poverty, economic stagnation and more political potential for another cycle of "Middle Class/Democratic" change.
data from https://cran.r-project.org/web/packages/elections/elections.pdf
winner winnerparty turnoutperc electionyear runnerup
1: WarrenHarding Rep. 49.2 1920 James Cox
2: CalvinCoolidge Rep. 48.9 1924 John Davis
3: HerbertHoover Rep. 56.9 1928 Al Smith
4: FranklinRoosevelt Dem. 56.9 1932 Herbert Hoover
5: FranklinRoosevelt Dem. 61.0 1936 Alf Landon
6: FranklinRoosevelt Dem. 62.4 1940 Wendell Willkie
7: FranklinRoosevelt Dem. 55.9 1944 Thomas Dewey
8: HarryTruman Dem. 52.2 1948 Thomas Dewey
9: DwightEisenhower Rep. 62.3 1952 Adlai Stevenson
10: DwightEisenhower Rep. 60.2 1956 Adlai Stevenson
11: JohnKennedy Dem. 63.8 1960 Richard Nixon
12: LyndonJohnson Dem. 62.8 1964 Barry Goldwater
13: RichardNixon Rep. 62.5 1968 Hubert Humphrey
14: RichardNixon Rep. 56.2 1972 George McGovern
15: JimmyCarter Dem. 54.8 1976 Gerald Ford
16: RonaldReagan Rep. 54.2 1980 Jimmy Carter
17: RonaldReagan Rep. 55.2 1984 Walter Mondale
18: GeorgeH.W.Bush Rep. 52.8 1988 Michael Dukakis
19: BillClinton Dem. 58.1 1992 George H. W. Bush
20: BillClinton Dem. 51.7 1996 Bob Dole
21: GeorgeW.Bush Rep. 54.2 2000 Al Gore
22: GeorgeW.Bush Rep. 60.1 2004 John Kerry
23: BarackObama Dem. 61.6 2008 John McCain
24: BarackObama Dem. 58.6 2012 Mitt Romney
25: DonaldTrump Rep. 60.2 2016 Hillary Rodham Clinton
winner winnerparty turnoutperc electionyear runnerup


No comments:
Post a Comment
Comments are moderated. Irrational,angry,promotional or off-topic comments will not be printed.