Examining voter registration as an predictive tool is a tricky process. Voter lists are notorious for their lack of accuracy due to voter relocation, morbidity, duplication; all of which leave your local county auditor struggling to keep their lists accurate. Nevertheless, looking at growth in new voters is potential marker of increased political interest.
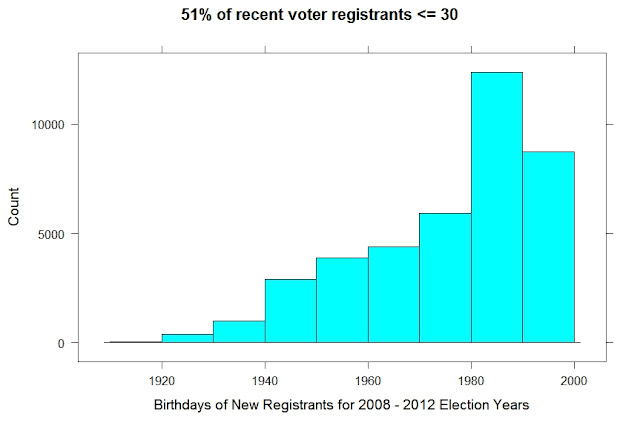
New voter registrations per year since 1992 are below. Whatcom County added ~ 40K to the voter roles for the 2008 - 2012 election years. 51% of these additions were from registrants 30 or under. It is highly probable that voter discontent has translated to significant voter registration increases in Whatcom County, especially among 'millenials', some of whom may or may not be students. Boomers and GenXers have a substantial presence in the voter registration rolls here.
Examining the histogram bins of the Pre-War (WWII) generation voter rolls reminds us of a sobering reality. Although recent predictions are for an older demographic in WA state, the truth is that morbidity rates in the U.S. turn up dramatically after age 50. The U.S. currently loses 2.7 M of its population each year. Where unintended accidents are the most common cause of death in the under 50 population, post 50 populations are hit hard in the United States by 'malignant neoplasm', 'heart disease', and nefarious other clinical causes of death.
Click on the graphs below to enlarge.
If we examine the last six presidential election years, we can clearly see the exceptional increases in registration for the last three presidential elections:
Year New Registrants1992 5752
1993 3190
1994 3134
1995 3585
1996 3540
1997 2341
1998 2470
1999 2831
2000 4378
2001 2273
2002 2818
2003 3050
2004 9533
2005 2789
2006 3737
2007 3625
2008 10579
2009 3834
2010 6819
2011 6689
2012 11750
Youth is driving these voter registration roll increases. Another way of looking at the most recent voter registrations is a ten year break histogram. Counts (x axis) are for each year, although each bin may not have 10 years.
The chart below compares birthdays of all registrants in ten bins. It could be expected that the more recent election years would sport much younger registrations. With over 20K registrations in the last five years, the "millenials" are registering in force in Whatcom County. Since we are at least a three college town (and student registration has reputedly increased), this could be expected. However, 40 and under registration is significant as well in the recent election years. The ten year break histograms below show boomers and genXers as the dominant voter registration blocks in Whatcom County. Counts (X axis) are for each year, although each bin may not have 10 years. The pre-war (WWII) generation still has substantial presence. Perhaps surprisingly, the pre-war presence on our voter rolls would appear to be decreasing as time shifts this graph to the right and in favor of surging youthful participation. But do they always participate?
Technical for this is coming...


